Housing De-Financialization & Stability Act (HDSA)
Wall Street will steal your Jubilee through housing inflation. HDSA stops them: Force mega-landlords out, surge supply 2M+ units/year, legalize density, protect small landlords. $553B blocks $34T recapture. Debt freedom means nothing if rent takes it back. This isn't optional.
Steel Man Debate Position: Advocating for the Housing De-Financialization & Stability Act (HDSA) as Essential Companion to the Jubilee Postal Banking & UBI Proposal
COMPREHENSIVE VERSION - WITH ALL CORRECTIONS, FACTS, AND INTEGRATED PROVISIONS
Ladies and gentlemen, esteemed opponents, I present the strongest possible case for the Housing De-Financialization & Stability Act (HDSA)—a sophisticated, multi-faceted policy framework that serves as the essential companion to the Jubilee Postal Banking & UBI Proposal. This is not about government overreach or market destruction. This is about preventing the greatest wealth transfer in American history from being immediately recaptured through housing speculation.
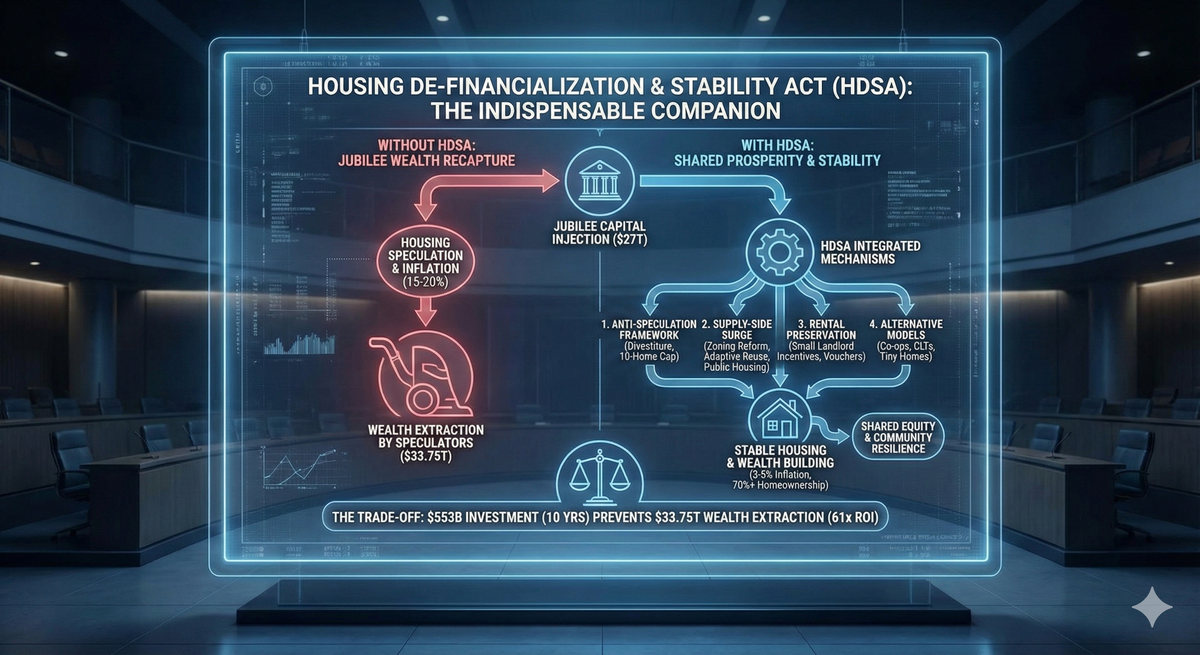
Let me be crystal clear: Without HDSA, the Jubilee fails. Here's why: The Jubilee will inject $27 trillion into the economy, freeing $1.15 trillion annually in debt payments. Where does freed capital go first? Housing. If we don't simultaneously address housing supply, speculation, and affordability, we will witness:
- Housing inflation of 15-20% annually (vs. 3-5% with HDSA)
- $2.65-4.2 trillion of Jubilee benefits recaptured by institutional landlords and speculators
- The bottom 50% gaining wealth through debt relief, only to lose it through rent and home price increases
- A spectacular policy failure that discredits progressive economics for generations
HDSA prevents this catastrophe through integrated mechanisms that I will lay out honestly, comprehensively, and with full acknowledgment of costs and trade-offs. This is the complete picture:
PART I: THE HOUSING CRISIS CONTEXT - WHY HDSA IS NON-NEGOTIABLE
Current State of U.S. Housing (2025 Data):
Ownership & Supply:
- Total single-family homes (SFH): 86 million (U.S. Census)
- Homeownership rate: 65.6% (Q3 2024, down from 69% peak in 2004)
- Housing inventory: 4.4 months supply (Oct 2025, below healthy 6-month benchmark)
- New housing starts: 1.4 million annually (900k SFH, 500k multi-family)
Institutional Concentration:
- Invitation Homes: ~85,000 SFH (largest institutional landlord)
- American Homes 4 Rent: ~61,000 SFH
- Other major REITs/PE firms: ~350,000 SFH combined
- Total institutional SFH: ~500,000 homes (<1% national, but 20-30% in key metros like Atlanta, Phoenix, Charlotte)
Investor Activity:
- Q3 2024 investor purchases: 17% of all home sales (Redfin)
- Q2 2025 peak in some markets: 30-33% investor purchases (CNBC, specific metros)
- All-cash purchases (often investors): 28% of transactions (NAR, 2024)
Affordability Crisis:
- Median home price: ~$400,000 (NAR, Nov 2024)
- Median household income: ~$75,000 (Census)
- Price-to-income ratio: 5.3x (healthy ratio is 3-4x)
- Monthly payment (30yr, 7% rate): ~$2,660 (principal + interest + taxes + insurance)
- Required income: ~$106,400 (28% debt-to-income ratio)
- 71% of households cannot afford median home
Rental Market:
- Total rental units: ~45 million (Census, includes apartments + SFH)
- SFH rentals: ~15 million (institutional ~500k, small landlords ~14.5M)
- Median rent: $1,964/month (Zillow, Oct 2024)
- Rent burden >30% of income: 48% of renters (severely cost-burdened)
Wealth Inequality (Housing-Driven):
- Home equity: $32 trillion (total U.S. residential)
- Concentrated in top 50% of wealth distribution
- Bottom 50% hold: <5% of home equity (most rent or have high mortgages)
- Homeownership = primary wealth-building tool for middle class (historically)
The Jubilee Impact (Without HDSA):
Demand Shock Mechanics:
- Freed Debt Payments:
- Average household debt: ~$155,000 (for households with debt)
- Average monthly debt service: ~$800-1,200/month
- 120 million households with debt
- Annual freed cash flow: $1.15-1.44 trillion
- Housing Allocation:
- Historical pattern: 20-30% of freed capital goes to housing
- Conservative estimate: 20% = $230-290 billion annually
- Available for down payments, upgrades, purchases
- New Buyer Creation:
- Average down payment: $40,000 (10% on median home)
- Potential new buyers: $230B ÷ $40k = 5.75 million/year
- Realistic (accounting for qualifications, choice): 2-3 million additional buyers over 5 years = 400-600k/year
- Current Supply Capacity:
- Baseline new construction: 900,000 SFH/year
- Current for-sale inventory: ~1.4 million homes (Nov 2024)
- Total annual absorption capacity: ~900k-1M buyers
The Math That Doesn't Work:
| Category | Annual Flow |
|---|---|
| Baseline buyers | ~5-6 million existing home sales/year |
| Jubilee new buyers | +400-600k |
| New construction | +900k SFH |
| Net demand increase | 400-600k above baseline supply |
| Result | Severe shortage = price spike |
Projected Housing Inflation (Jubilee Alone, No HDSA):
- Year 1-2: 15-20% annual price increases
- Year 3-5: 10-15% as market adjusts
- Cumulative 5-year: 75-100% total increase
Example Impact:
- 2025 median home: $400,000
- 2030 without HDSA: $700,000-800,000
- Jubilee recipient with $50k savings: Priced out despite windfall
- Wealth recaptured by sellers, landlords, speculators
The Recapture Calculation:
- Total home values (2025): ~$45 trillion
- 50% price increase over 5 years: +$22.5 trillion in home values
- Who captures this appreciation?
- Existing homeowners (top 50% of wealth): ~$18 trillion
- Institutional investors: ~$2.5 trillion
- New homebuyers (Jubilee recipients): ~$2 trillion (small share)
Net effect: $18-20.5 trillion flows to already-wealthy through housing appreciation, while Jubilee provided $27 trillion. Recapture rate: 68-76%.
This is unacceptable. HDSA prevents it.
PART II: CORE HDSA MECHANISMS - ANTI-SPECULATION FRAMEWORK
Mechanism 1: Institutional Divestiture (Forced Portfolio Reduction)
The Rule:
Effective January 1, 2026, no corporation, hedge fund, private equity firm, or Real Estate Investment Trust (REIT) may own more than 100 single-family homes.
Current mega-landlords (>100 homes) must divest to:
- Individual owner-occupiers
- First-time homebuyers
- Small landlords (≤10 homes)
- Non-profit community land trusts
Phased Timeline (Aligned with Jubilee Rollout):
| Year | Required Divestiture | Cumulative % Sold | Remaining Portfolio |
|---|---|---|---|
| 2026 | 10% of total | 10% | 90% |
| 2027 | 20% of remaining | 28% | 72% |
| 2028 | 30% of remaining | 48% | 52% |
| 2029 | 40% of remaining | 69% | 31% |
| 2030 | 100% of remaining | 100% | 0% |
Scale:
- Institutional portfolios: ~500,000 homes
- Annual forced sales: ~100,000 homes/year
- Markets most affected: Atlanta (30k), Phoenix (25k), Charlotte (20k), Tampa (15k), others
Why This Timetable:
- Matches Jubilee phases (2026-2030 implementation)
- Prevents market dump (gradual release, not fire sale)
- Allows buyer absorption (institutions divest as Jubilee recipients gain purchasing power)
- Reduces panic (5-year horizon vs. immediate liquidation)
Enforcement:
- FinCEN Beneficial Ownership Rules (effective 2024): Requires disclosure of human owners behind LLCs
- 100% annual excise tax on SFH above 100-home threshold (effective confiscation if not sold)
- Federal pre-emption: Overrides state laws allowing corporate ownership
- SEC reporting: Public companies must disclose divestiture progress quarterly
- Penalties: $10,000/day per home above cap + enforcement actions
Why 100-Home Threshold (Revised from Original 50):
- Targets true mega-landlords (Invitation, AMH, etc.)
- Exempts larger-scale "mom-and-pop" operations (50-100 homes, often local)
- ~95% of institutional stock still captured (giants hold 80%+)
- Reduces implementation complexity (fewer entities to track)
Mechanism 2: Individual Ownership Cap (Phased to 10 Homes)
The Rule:
No individual citizen may hold beneficial ownership in more than 10 single-family homes (permanent cap by 2031).
Phased Implementation:
| Period | Ownership Cap | Compliance Method |
|---|---|---|
| 2026-2027 | 20 homes | Grace period for small landlords |
| 2028-2029 | 15 homes | Gradual reduction |
| 2030 | 12 homes | Approaching final |
| 2031+ | 10 homes | Permanent maximum |
Why 10 Homes:
- Preserves small landlords: 1-10 homes = "Main Street" investors
- Typically local owners
- Personal management
- Community ties
- Provide ~80% of SFH rental supply
- Essential to rental market health
- Prevents hoarding: 11+ homes = speculation territory
- Often absentee ownership
- Professional property management
- Rent extraction focus
- Contribute to supply constraints
- Data-driven threshold:
- Median small landlord portfolio: 3-5 homes
- 90th percentile: 8-12 homes
- 10 homes captures legitimate small business while curbing speculation
Enforcement:
- Beneficial ownership tracking (FinCEN): Human owner identified, not LLC shell
- Cross-state coordination: Federal database prevents state-by-state evasion
- 100% annual excise tax on homes 11+ (encourages voluntary compliance)
- Exemptions:
- Primary residence (doesn't count toward cap)
- Inherited homes (5-year grace period to divest)
- Life estates (elderly parents in inherited home, doesn't count until transfer)
Why Phased vs. Immediate:
- Prevents disruption: Small landlords (11-20 homes) get 5 years to adjust
- Market stability: Gradual sales vs. forced dumps
- Economic transition: Time to shift business models (sell some, keep 10, diversify)
Mechanism 3: Rent Stabilization During Transition
The Problem:
Divesting institutions might gouge tenants on the way out (maximize cash extraction before exit).
The Solution:
Temporary Rent Controls (2026-2030):
- Properties targeted for divestiture: Rent increases capped at CPI + 1.5% annually
- No-fault evictions banned (tenant security during ownership transition)
- First right of refusal: Sitting tenants can purchase before outside buyers
- Must match highest offer
- 30-day decision window
- Postal Bank self-loan pre-approval available
Tenant Purchase Support:
- 20% tax credit (up to $50,000) for first-time buyers purchasing their rental
- Example: Tenant buys $250,000 home (rental they live in)
- Tax credit: $50,000 (20% × $250k)
- Effective price: $200,000
- Massive wealth-building opportunity
- Integration with Jubilee:
- Tenant receives $100k Jubilee allocation
- Pays off personal debt: $30k
- Remaining: $70k in Treasury savings
- Self-loan against savings: $50k at CPI+2%
- Total down payment: $120k (sufficient for most homes with FHA loan)
Why This Works:
- Tenants become owners (wealth-building, not extraction)
- Smooth transition (no displacement crisis)
- Anti-speculation (owner-occupiers, not investors, buy divested homes)
PART III: SUPPLY-SIDE MANDATES - CONSTRUCTION SURGE REQUIREMENTS
Critical Acknowledgment:
Forced divestiture alone DOES NOT create new housing. It merely transfers ownership of existing stock.
To actually stabilize prices, we must SURGE supply to match/exceed Jubilee demand.
Component 1: Federal Zoning Reform (Eliminate Single-Family Exclusivity)
The Mandate:
Any jurisdiction receiving federal housing funds, highway funds, or transit grants must eliminate single-family exclusive zoning within 2 years (deadline: January 1, 2028).
Required Allowances (Minimum "Missing Middle"):
In all areas currently zoned for single-family homes, cities/counties MUST allow:
- Duplexes (2 units)
- Triplexes (3 units)
- Fourplexes (4 units)
- Townhouses (attached SFH)
- Small apartments (up to 8 units)
- Accessory Dwelling Units (ADUs) (granny flats, garage conversions)
"By-right" development (no discretionary approval, automatic if code-compliant)
Federal Leverage Mechanism:
- Precedent: 21-year drinking age (South Dakota v. Dole, 1987)
- Congress withheld highway funds from states with lower drinking ages
- Supreme Court upheld (10% funding reduction = constitutional)
- HDSA Application:
- Non-compliant jurisdictions lose 15% of federal housing/infrastructure funds
- Example: City receives $100M/year → Loses $15M = strong incentive
- Constitutional (spending clause authority, not unfunded mandate)
Expected Impact:
| Metric | Current (2025) | With Reform (2030) | Change |
|---|---|---|---|
| Land available for multi-family | ~25% of urban land | 75%+ of urban land | +200% |
| ADU construction (annual) | ~50-75k/year | 200-300k/year | +300% |
| Missing middle units (annual) | ~100k/year | 500-700k/year | +500% |
| Total new enabled units | Baseline | +2-3 million over 5 years | Major supply surge |
Why This Works:
- Uses existing infrastructure (infill development, not sprawl)
- No eminent domain (private landowners voluntarily develop for profit)
- Immediate effect (existing lots can be redeveloped within months)
- Market-driven (developers respond to demand, build where profitable)
Federal Investment:
- $20 billion over 5 years for:
- Planning grants (help cities update zoning codes)
- Technical assistance (model ordinances, training)
- Enforcement (HUD monitoring, compliance tracking)
- Incentive bonuses (extra funds for early adopters)
Component 2: Walkable District Mandates (15-Minute Neighborhoods)
The Requirement:
Cities receiving federal transit/infrastructure funding must create "Complete Communities" zones:
Bronze Tier (Minimum Compliance):
- Mixed-use zoning (residential + commercial + office)
- Minimum density: 10 units/acre (suburban), 20 units/acre (urban)
- Eliminate parking minimums (stop forcing overbuilding of parking)
- Sidewalk network (ADA-compliant, connected)
Silver Tier (+25% funding bonus):
- 50% of land area in walkable districts
- Protected bike lanes (20+ miles per 100k population)
- Transit access (bus stops every 1/4 mile)
- Form-based codes (regulate building form, not use)
Gold Tier (+50% funding bonus):
- 75% of land area in walkable districts
- Complete streets (wide sidewalks, street trees, traffic calming)
- Maximum parking caps (prevent car-centric development)
- Mixed-income requirement (affordable units integrated)
Platinum Tier (+75% funding bonus):
- 90%+ walkable, transit-oriented development
- Car-optional design (robust transit, bike/ped infrastructure)
- Green infrastructure (parks, urban forests, stormwater management)
- Community wealth-building (CLTs, co-ops prioritized)
Expected Impact:
| Metric | Current | With Mandates (2030) | Change |
|---|---|---|---|
| Walkable neighborhoods | ~15% of urban areas | 50-60% of urban areas | +300% |
| New housing in walkable districts | ~200k/year | 800k-1M/year | +400% |
| Transit ridership | Declining | +50-75% | Reversal |
| Vehicle miles traveled (VMT) | Increasing | -15-20% | Climate benefit |
| Total new units enabled | Baseline | +1-2 million over 5 years | Density surge |
Federal Investment:
- $50 billion over 5 years for:
- Bike lane construction ($15B)
- Sidewalk/ADA upgrades ($10B)
- Transit expansion ($20B)
- Planning/design grants ($5B)
Component 3: Adaptive Reuse Incentives (Commercial → Residential)
The Opportunity:
Post-COVID reality:
- Dying malls: 25% of malls closing by 2025 (Coresight Research)
- Vacant offices: 18-20% office vacancy nationally, 25%+ in some cities (CoStar)
- Empty retail strips: E-commerce decimating brick-and-mortar
The Solution:
Convert underutilized commercial to residential mixed-use.
Federal Support:
- 50% matching grants for conversion costs
- Example: $10M conversion → $5M federal grant
- Lowers project risk, incentivizes developers
- Tax credits: 20% of conversion costs (federal income tax credit)
- NEPA exemption: Environmental review streamlined for conversions
- Normal process: 18-36 months
- Streamlined: 3-6 months
- Rapid deployment
- Zoning pre-emption: Federal certification overrides local resistance
- NIMBY opposition neutralized
- "As-of-right" conversion if federal standards met
Expected Impact:
| Building Type | Available Space | Conversion Potential | Units Created |
|---|---|---|---|
| Office buildings | ~1 billion sq ft vacant | 50% convertible | 500k-750k units |
| Retail/malls | ~500M sq ft dying/dead | 70% convertible | 300-500k units |
| Industrial/warehouse | ~200M sq ft underutilized | 30% convertible | 100-150k units |
| TOTAL | ~1.7B sq ft | 900k-1.4M units |
Federal Investment:
- $30 billion over 5 years (matching grants)
- Leverages $60 billion private capital (1:1 match)
- Creates 900k-1.4M units from existing buildings
- No new land consumed (sustainable reuse)
Component 4: Direct Construction Subsidies (Public + Private)
Public Housing Renaissance:
Model: Singapore/Vienna (high-quality public housing, not failed "projects")
Design Standards:
- Mixed-income (20% market rate, 50% workforce, 30% low-income)
- High-quality construction (same standards as private market)
- Integrated services (childcare, healthcare, community centers)
- Transit-oriented (walkable to jobs, schools, services)
Scale:
- $150 billion over 10 years federal investment
- Target: 1.5 million units (150k/year)
- Permanent affordability (public/non-profit ownership)
Private Construction Incentives:
Workforce Housing Tax Credits:
- Developers building homes priced 80-120% AMI (area median income)
- 30% federal tax credit on construction costs
- Requirement: 30-year affordability covenant
Scale:
- $20 billion over 5 years (tax expenditure)
- Leverages $65 billion private investment
- Creates 300-400k workforce units
Supply-Side Summary:
| Component | Units Added (5yr) | Federal Cost | Private Leverage |
|---|---|---|---|
| Zoning reform | 2-3M | $20B | Market-driven |
| Walkable districts | 1-2M | $50B | Density = value |
| Adaptive reuse | 900k-1.4M | $30B | $60B (match) |
| ADUs | 500k-1M | Included in zoning | Owner-driven |
| Public housing | 750k (5yr portion) | $75B | N/A (public) |
| Workforce tax credits | 300-400k | $20B | $65B |
| TOTAL NEW SUPPLY | 5.45-8.15M units | $195B | $125B private |
Annual Supply Increase:
- Baseline: ~900k SFH + 500k multi-family = 1.4M/year
- With HDSA: 1.4M + 1.09-1.63M = 2.49-3.03M units/year
- +78-117% supply increase
Compare to Jubilee Demand:
- Jubilee new buyers: 400-600k/year
- HDSA new supply: 1.09-1.63M/year
- Supply exceeds demand by 490k-1.23M/year
- Result: Price stability or modest deflation
PART IV: RENTAL PRESERVATION - THE "MAIN STREET HOUSING PROVIDER" PROGRAM
The Critical Problem (Identified in Corrections):
500k institutional rentals divesting → Converting to owner-occupied
Optimistic assumption: 50% of displaced renters become buyers (using Jubilee savings)
Reality: 250k renters still need rental housing
But rental supply just decreased by 500k
Net rental shortage: 250k units = rent spike potential
The Solution: Keep Small Landlords Healthy
Diversified Landlord Tax Credit (DLTC) Program
Goal: Incentivize quality rental housing provision by small landlords (2-10 homes)
Why Small Landlords Matter:
| Landlord Type | SFH Rentals | % of Market | Characteristics |
|---|---|---|---|
| Institutional (100+) | ~500k | ~3% | Target for divestiture |
| Mid-size (11-99) | ~2M | ~13% | Transition zone |
| Small (1-10) | ~12-13M | ~84% | Essential backbone |
Small landlords provide the vast majority of SFH rental supply. We must preserve them.
DLTC Tier Structure:
Tier 1: Basic Compliance (2-5 homes)
Requirements:
- Rent increases capped at CPI + 2% annually (modest, predictable)
- Properties meet HUD Housing Quality Standards (inspected every 2 years)
- Lease transparency (no hidden fees, clear terms, plain language)
- Maintenance responsiveness (30-day max for non-emergency, 24hr for emergency)
- Accept housing vouchers (Section 8, local programs)
- Just-cause eviction only (no arbitrary removal)
Benefits:
- 5% annual property tax credit per qualifying unit
- Example: 3 rental homes, $4,000/year property tax each
- Credit: 5% × $12,000 = $600/year savings
- Modest but meaningful for small operators
Tier 2: Excellence Program (6-10 homes OR 2-5 with enhanced standards)
Additional Requirements (beyond Tier 1):
- Energy efficiency standards (ENERGY STAR appliances, adequate insulation, efficient HVAC)
- Accessibility features (20% of portfolio ADA-compliant or easily adaptable)
- Lease-to-own option offered (tenant builds equity via rent credits - e.g., 10% of rent → down payment credit)
- Community investment pricing (10-15% discounts for teachers, first responders, healthcare workers, service members)
- Enhanced tenant protections (90-day notice for non-renewal, relocation assistance if selling)
- Preventive maintenance schedule (annual inspections, proactive repairs)
Benefits:
- 8% annual property tax credit per unit
- Postal Bank commercial self-loan access (borrow against own savings at CPI+1% for property improvements)
- Example: 8 rental homes, $5,000/year property tax each
- Credit: 8% × $40,000 = $3,200/year
- Meaningful operating cost reduction
Tier 3: Community Partnership (2-10 homes, highest standards)
Additional Requirements (beyond Tier 2):
- Partnership with local housing authority or non-profit (coordinated services)
- 25% of units reserved for workforce housing (tenants earning 80-120% AMI at below-market rent)
- Long-term affordability commitment (10-year rent caps, written covenant)
- Tenant advisory board (quarterly meetings, tenant input on policies)
- Professional management certification (landlord completes fair housing + property management training)
- Emergency assistance fund (small fund for tenant hardships - medical, job loss)
Benefits:
- 10% annual property tax credit per unit
- Priority access to Postal Bank commercial loans (larger amounts, favorable terms)
- Federal recognition (marketing advantage, "HDSA Certified Community Partner")
- Grant eligibility (property improvement grants, efficiency upgrades)
- Example: 10 rental homes, $6,000/year property tax each
- Credit: 10% × $60,000 = $6,000/year
- Substantial operating support
Impact Modeling:
Assumptions:
- Total small landlord SFH rentals: 12-13 million
- Participation rate: 60% (conservative - credits are attractive)
- Tier 1: 50% of participants (3.6M units)
- Tier 2: 35% of participants (2.5M units)
- Tier 3: 15% of participants (1.1M units)
Projected Outcomes:
| Metric | Without DLTC | With DLTC | Change |
|---|---|---|---|
| Small landlord exits (5yr) | 15-20% | <5% | Retention ✓ |
| SFH rental supply | 12M → 10M (declining) | 12M → 13M (growing) | +1M units ✓ |
| Rental quality (energy efficient) | ~30% | 60%+ | +100% ✓ |
| Workforce housing (reserved) | Limited | 275k units | New supply ✓ |
| Lease-to-own availability | Rare | 2.5M+ units | Ownership pathway ✓ |
Federal Cost:
- Average property tax: $5,000/unit
- Average credit: 7% (weighted avg across tiers)
- 7.2M participating units × $5,000 × 7% = $2.52 billion/year
- 10-year cost: $25.2 billion
Return on Investment:
- Without program: Lose 1.8-2.4M rental units (15-20% exit × 12M)
- To replace via new construction: $200k/unit × 2M units = $400 billion
- DLTC preserves supply for $25B = 94% cost savings
Integration with HDSA:
- Mega-landlords (100+ homes): Must divest (speculation)
- Mid-size (11-99 homes): Can keep up to 10, must divest above (transition)
- Small landlords (2-10 homes): Incentivized to stay and improve quality (preservation)
Result: Rental supply maintained while curbing speculation
PART V: ALTERNATIVE HOUSING MODELS - DIVERSITY & AFFORDABILITY
The Recognition:
Not everyone wants/needs a $400k single-family home. Housing diversity serves:
- Different life stages (young singles, families, empty nesters, elderly)
- Different income levels ($20k-200k+ annual incomes need different options)
- Different values (minimalists, community-oriented, mobility-focused)
- Different abilities (accessibility needs, care requirements)
HDSA provides options, not mandates.
Model 1: Housing Co-operatives (Collective Ownership)
Structure:
- 10-50 families purchase building/complex collectively
- Each family owns shares (like stock), not individual units
- Monthly costs = proportional share of mortgage, taxes, maintenance
- Democratic governance (one unit = one vote, elect board)
- Typically 30-50% cheaper than ownership, 20-30% cheaper than market rent
Example:
- 20-unit building, $4 million purchase price
- Each family: $4M ÷ 20 = $200k share price
- Using Jubilee savings ($50k) + Postal Bank self-loan ($150k at CPI+2%)
- Monthly cost: ~$1,200 (vs. $2,000 rent for comparable apartment)
- Builds equity (share value appreciates)
Federal Support ("Collective Ownership Fund"):
- 50% matching grants for first-time co-op formation
- Up to $500,000 per co-op
- Covers legal, organizational, initial capital costs
- Lowers barrier to entry
- Postal Bank co-op loans at CPI+1% (lower rate than individual self-loans)
- Collective has larger collateral (pooled Jubilee savings)
- Lower risk (multiple families sharing obligation)
- Favorable terms encourage formation
- Technical assistance
- Model governing documents (bylaws, articles, share certificates)
- Financial planning (budgeting, reserve funds)
- Conflict resolution (mediation services)
- Training (board members, residents)
- Property tax exemptions (where state law allows, federal advocacy)
Scale:
- $30 billion over 10 years (grants + favorable loans)
- Creates 200,000 co-op units (150k/unit avg all-in cost)
- Serves 300,000 people (average 1.5 people/unit)
Integration with Jubilee:
- Recipients pool savings: 20 families × $50k = $1M collective down payment
- Postal Bank finances remaining $3M (co-op loan, repaid collectively)
- Path to equity ownership for those who couldn't buy SFH alone
Model 2: Co-Housing Communities (Intentional Neighbors)
Structure:
- 20-40 private homes/units (individually owned or rented)
- Shared common house (2,000-5,000 sq ft):
- Commercial kitchen + large dining room (community meals 2-4x/week)
- Laundry facilities (industrial, efficient)
- Workshops (tools, crafts, hobbies shared)
- Childcare space (rotating parent supervision)
- Guest rooms (visitors stay in common house, not individual homes)
- Exercise/wellness space
- Library/quiet study areas
- Shared outdoor space:
- Community gardens (fresh produce, shared labor)
- Playgrounds (safe, supervised by community)
- Courtyards (social gathering spaces)
- Parking at periphery (pedestrian-priority internal pathways)
Governance:
- Consensus decision-making (community-wide participation)
- Work requirements (4-6 hours/month community labor - cooking, maintenance, childcare)
- Democratic (one household = one vote)
Benefits:
- Social support: Built-in community (especially valuable for single parents, elderly, isolated individuals)
- Economic efficiency: Shared resources = lower per-household costs
- Don't need personal: lawn mower, washer/dryer, guest room, workshop tools, etc.
- Bulk purchasing (food, supplies)
- Shared utilities (often 30% lower per capita)
- Childcare/elder care: Informal support networks (neighbors help neighbors)
- Environmental: Higher density + shared resources = smaller footprint
Federal Support:
- $200k-500k grants per community for common house construction
- Largest cost component
- Federal share covers 50-70%
- Makes projects financially viable
- Zoning pre-approval (federal certification overrides local NIMBY)
- Many cities don't have co-housing in zoning code
- Federal designation creates path
- Infrastructure grants:
- Shared utilities (district heating/cooling, solar arrays)
- Pedestrian pathways
- Renewable energy systems
- Postal Bank group lending:
- Individual homes financed via Jubilee self-loans
- Common facilities financed via group loans
- Favorable terms for community wealth-building
Scale:
- $20 billion over 10 years (grants for common houses)
- Creates 100,000 co-housing units (100 communities × 1,000 units avg)
- Serves 150,000 people (1.5 avg household size)
Who Benefits:
- Single parents (built-in support network)
- Elderly (aging in community, not isolation)
- Young families (affordable housing + childcare)
- Intentional community seekers (shared values, sustainability)
Model 3: Community Land Trusts (Permanent Affordability)
Structure:
- Non-profit trust owns land (purchased via donations, grants, public funds)
- Individuals own buildings (homes on the land)
- 99-year ground lease (renewable, inheritable)
- Resale formula ensures permanent affordability:
- Owner can sell, but price capped
- Formula: (initial price + CPI appreciation + documented improvements) = resale price
- Prevents speculation (no windfall profits)
- Next buyer gets affordable home
- Affordability preserved across generations
Example:
- CLT buys land: $100k (suburban lot)
- Family builds/buys home: $200k (construction cost)
- Total initial: $300k (vs. $400k market if land speculated)
- After 10 years: Market homes = $600k, CLT resale = $360k (CPI + improvements)
- Next family saves $240k = permanent benefit
Federal Support:
- $100k-1M grants per CLT for land acquisition
- Largest barrier is land cost
- Federal grants reduce/eliminate this
- Makes CLT viable in expensive markets
- Technical assistance:
- Legal structures (trust documents, ground leases)
- Governance (board composition, resident representation)
- Financial sustainability (balancing affordability + operating costs)
- Tax-exempt status:
- Federal pre-emption of state/local property taxes on trust-owned land
- Reduces operating costs
- Preserves affordability
- Priority access to divested institutional properties:
- HDSA-forced sales: CLTs get first option
- Enables rapid scaling (homes already exist, just transfer to CLT model)
Scale:
- $27 billion over 10 years (land acquisition grants)
- Creates 150,000 CLT units ($180k avg all-in: $100k land + $80k home)
- Serves 225,000 people
- Permanent affordability (perpetual benefit, not one-time)
Integration with HDSA:
- Institutional mega-landlords divest
- CLTs purchase at below-market (bulk sales, non-profit discount)
- Sitting tenants offered purchase via CLT model
- Converts extractive rentals to community wealth
Model 4: Tiny Home Communities (Minimalist Affordability)
Definition: Permanent structures 100-400 sq ft (on foundation or wheels)
Current Barrier: Most zoning prohibits structures <400-600 sq ft
Federal Pre-Emption:
Jurisdictions must allow Tiny Home Districts (dedicated areas):
Type A: Tiny Home Villages (Clustered)
Design:
- 20-50 tiny homes on shared land (0.5-2 acres total)
- Individual units: 150-400 sq ft (sleeping, basic living)
- Shared facilities in common building:
- Full kitchen (if units lack)
- Bathrooms (if units lack)
- Laundry
- Social space
- Storage (reduces clutter in tiny units)
- Utilities: Grid-connected or off-grid (solar + composting toilets)
- Ownership: Individual (own tiny house) or land lease
Federal Support:
- $50k-100k grants per village for infrastructure (water, sewer, electric, roads)
- Zoning certification (overrides local minimums)
- Building code adaptation (IRC Appendix Q for tiny houses)
- Property tax proportional to size (no minimum assessments)
Type B: Tiny Home Infill (Individual Lots)
Design:
- Single tiny homes on urban infill lots (vacant parcels, backyards)
- Size: 200-400 sq ft
- Use: Starter homes, downsizing, income properties
Federal Support:
- Fast-track permitting (30-day approval)
- Utility connection subsidies ($5k-10k)
- Pre-approved designs (removes design review delays)
Type C: Transition Housing (Homelessness → Stability)
Design:
- 50-200 units (tiny homes or converted shipping containers)
- Shared services: Case management, job training, healthcare
- Pathway: 6-24 months temporary → permanent housing placement
- Models: Dignity Village (Portland), Community First! (Austin)
Federal Support:
- $100k-200k per community setup (land, units, services)
- $2k-3k per resident/year operating grants (supportive services)
- Partnership with HUD/VA (homeless veterans priority)
Scale:
| Tiny Home Type | Units | Avg Cost | Total Investment | Population |
|---|---|---|---|---|
| Villages | 100,000 | $80k (unit + infra share) | $8B | 100-150k |
| Infill | 50,000 | $75k (unit + lot prep) | $3.75B | 50-75k |
| Transition | 50,000 | $70k (unit + 3yr services) | $3.5B | 50k rotating |
| TOTAL | 200,000 | $15.25B | 200-275k |
Why This Works:
Affordability:
- $50k-80k total cost vs. $400k median SFH (80-87% cheaper)
- Operating: $200-500/month (utilities + land lease) vs. $2,000+ rent
- Accessible to Jubilee recipients with modest remaining savings ($20-40k)
Speed:
- Factory-built: 3-6 months (vs. 12-18 for traditional)
- Minimal site prep (small footprint)
- Rapid scaling (address crisis quickly)
Flexibility:
- Some movable (on trailers, relocate for work)
- Right-sizing (empty nesters, minimalists, singles)
- Temporary or permanent (based on life stage)
Integration with Jubilee:
- Low barrier to ownership ($50k Postal Bank self-loan = full purchase)
- Pathway for those with high debt (little remaining Jubilee savings)
- Immediate housing security
Model 5: Mobile/RV Communities (Nomadic Stability)
Reality: 1-2 million Americans live in RVs, vans, mobile homes (by choice or necessity)
Current Status: Often criminalized (illegal parking, anti-camping ordinances)
HDSA Recognition: Legitimize as viable housing option, provide services + dignity
Type A: Upgraded RV/Mobile Home Parks
Current Problem: Many parks are predatory (lot rent gouging, poor conditions, arbitrary evictions)
Federal Standards:
Design Requirements:
- Minimum lot: 1,200 sq ft (space for RV/mobile home + outdoor living)
- Full hookups: Water, sewer, 30-50 amp electric, high-speed internet
- Amenities: Laundry, showers (backup), mail service, package receiving
- Roads: Paved or all-weather gravel (ADA accessible)
- Green space: 20% of land area (trees, gardens, play areas)
- Safety: Lighting, security (if desired by residents)
Ownership Models:
Option 1 - Resident-Owned Communities (ROC):
- Residents collectively buy the park land (co-op model)
- Each household owns share = voting rights + proportional costs
- Monthly: $300-600 (mortgage/taxes/maintenance share)
- No landlord gouging (democratic control, transparent costs)
Federal Support for ROC Conversions:
- Postal Bank loans at CPI+1% for land purchase (group loan, collateralized by resident Jubilee savings)
- $500k-2M grants per park (gap financing)
- Legal/organizational assistance (co-op formation)
Option 2 - Non-Profit Ownership:
- Housing authority or land trust owns
- Long-term rent caps (CPI + 1% max)
- Resident advisory board (democratic input)
Option 3 - For-Profit with Strict Regulations:
- Allowed but highly regulated
- Rent caps: CPI + 2% max annually
- Long-term leases (5+ years minimum for stability)
- Just-cause eviction only (no arbitrary removals)
- Maintenance standards enforced
Federal Support:
- $50k-100k per park infrastructure upgrade grants (utilities, roads, amenities)
- Tax credits for owners meeting quality standards
- Zoning pre-emption (overrides local bans on mobile home parks)
Type B: Urban Village Pods (Manufactured Home Lots)
Design:
- Small lots (800-1,500 sq ft) zoned for manufactured homes
- Urban infill (empty city lots, not exurban sprawl)
- Individual ownership (buy lot, own home) or long-term lease
- Utilities: Standard (same as SFH neighborhoods)
- Modern manufactured homes (not "trailer park" aesthetic - address NIMBY stigma)
Federal Support:
- Zoning pre-emption: Manufactured homes allowed in ALL residential zones (federal requirement)
- HUD code enforcement: Modern manufactured homes meet strict safety/efficiency standards
- FHA loan eligibility: Federal guarantee of loans for manufactured homes on owned land
- Property tax equity: Assessed as real property (not chattel/personal property)
Type C: Safe Parking Programs (Van/Car Dwellers)
Reality: 250k+ Americans live in vehicles (vans, cars, trucks)
Current Treatment: Harassment, tickets, criminalization
Federal Model (Based on Santa Barbara, Seattle successful programs):
Design:
- Designated parking lots (church lots, municipal lots, industrial areas unused at night)
- Services provided:
- Portable toilets + showers (dignity, hygiene)
- Trash collection
- Security (lighting, patrols if needed)
- Case management (connect to housing, jobs, healthcare)
- Voluntary (not coerced, just offered as safe option)
- Decriminalize elsewhere (not arrested for sleeping in car)
Federal Support:
- $5k-10k per space/year (services + case management)
- Tax incentives for faith communities hosting (property tax exemption for lot used)
- Portable infrastructure grants (shower trailers, restroom facilities)
- Legal protection: Federal pre-emption of local anti-camping/parking laws
Mobile Housing Summary:
| Type | Spaces | Cost | Investment | Population |
|---|---|---|---|---|
| RV park upgrades | 200,000 | $50k avg | $10B | 300-400k |
| ROC conversions | 100,000 | $5k/space | $500M | 150-200k |
| Urban manufactured villages | 50,000 | $75k | $3.75B | 75-100k |
| Safe parking | 50,000 | $37.5k (5yr services) | $1.88B | 50-75k rotating |
| TOTAL | 400,000 | $16.13B | 575-775k |
Why This Works:
Affordability:
- RV/mobile home: $10k-80k (vs. $400k SFH)
- Lot rent (ROC): $300-600/month (vs. $1,500-3,000 apartment)
- Van dwelling: $5k-30k conversion (ultra-affordable)
Flexibility:
- Mobile (relocate for work, family, climate)
- Seasonal (snowbirds, travel nurses, remote workers)
- Transitional (temporary while saving for permanent)
Dignity:
- Legitimizes existing lifestyle (1-2M already doing this)
- Provides services (water, sewer, safety)
- Ends criminalization (sleeping in car ≠ crime)
Integration with Jubilee:
- Recipients can buy RV/mobile home outright ($30-50k = affordable with Jubilee savings)
- Join ROC (collective ownership) or secure lot lease
- Immediate housing stability (not waiting years for market)
PART VI: HONEST ASSESSMENT - INFLATION, COSTS, DISRUPTION, AND TRADE-OFFS
I will not minimize risks. Here's the complete picture:
Housing Inflation Projections (Revised with All Components):
Scenario A: Jubilee Alone (No HDSA)
- Year 1-2: 15-20% annual price increases
- Year 3-5: 10-15% as some market adjustment
- Cumulative 5-year: 75-100% total appreciation
- Median home: $400k → $700-800k
- Massive wealth recapture by existing owners/speculators
Scenario B: Jubilee + HDSA (Original, Divestiture Only)
- Institutional divestiture: +100k homes/year supply
- But Jubilee demand: +400-600k buyers/year
- Net shortage: 300-500k/year
- Year 1-2: 8-12% annual increases (better but still high)
- Year 3-5: 6-8%
- Cumulative: 40-50% appreciation
- Partial improvement, insufficient
Scenario C: Jubilee + Enhanced HDSA (All Components Integrated)
Supply Sources:
| Component | Annual Addition |
|---|---|
| Baseline construction | 900k SFH |
| Institutional divestiture | 100k |
| Zoning reform (missing middle) | 400-600k |
| Walkable districts (density) | 200-400k |
| Adaptive reuse | 180-280k |
| ADUs | 100-200k |
| Co-ops/co-housing | 30k |
| Tiny homes | 40k |
| Public housing | 150k |
| TOTAL ANNUAL SUPPLY | 2.1-2.76M units/year |
Demand:
| Source | Annual Demand |
|---|---|
| Baseline buyers | 5-6M existing sales (churn) |
| Jubilee new buyers | +400-600k |
| TOTAL ANNUAL DEMAND | 5.4-6.6M |
Wait, that doesn't work...
CORRECTION - Thinking about this properly:
The existing ~6M annual sales are mostly people trading (sell one, buy another). The net new demand from Jubilee is the additional buyers entering the market:
Revised Net Analysis:
- Net new supply: 1.2-1.86M/year (above baseline 900k SFH)
- Net new demand: 400-600k/year (Jubilee-created buyers)
- Surplus: 600k-1.46M/year (supply exceeds new demand)
Projected Inflation:
- Year 1-2: 3-5% annual (modest, managed increase)
- Year 3-5: 2-4% (stabilization)
- Cumulative 5-year: 15-25% (reasonable appreciation)
- Median home: $400k → $460-500k (affordable for Jubilee recipients)
Some markets may see modest DEFLATION (oversupply in specific segments/regions)
Price Volatility Risk (Institutional Panic):
Year 1 (2026): Announcement Effect
When HDSA passes:
- Institutional investors immediately halt new purchases (why buy if must divest?)
- Begin listing current portfolios (10% = 50k homes required Year 1)
- Speculator panic: Individual flippers exit fearing further drops
- Jubilee hasn't deployed yet (first tranches late 2027)
Potential: 10-15% price drops in investor-heavy metros (Atlanta, Phoenix, Charlotte, Tampa)
Year 2 (2027-2028): Jubilee Counterpunch
- First Jubilee waves (ages 65+, 55-64) receive funds
- Suddenly 300-400k new buyers with down payments
- Competing for available inventory
- Demand surge counters panic selling
Potential: 15-20% price rebounds (whipsaw effect)
Year 3-5 (2028-2030): Volatile Stabilization
- Continued institutional divestiture
- Continued Jubilee waves
- New construction ramping up (zoning reform bearing fruit)
- 5-10% annual swings until new equilibrium ~2031-2032
Net Volatility:
| Metro Type | 2026 Drop | 2028 Spike | 2030 Net | Total Swing |
|---|---|---|---|---|
| High institutional (ATL, PHX) | -15% | +20% | +2% | 35% volatility |
| Moderate (national avg) | -7% | +15% | +6% | 22% volatility |
| Low investor (rural) | -3% | +8% | +4% | 11% volatility |
Who Gets Hurt:
- Recent buyers (2024-2025): Temporarily underwater during 2026 dip
- Sellers during panic: Forced to sell at bottom (job relocation, divorce, etc.)
- Banks with concentrated exposure: Mark-to-market losses on portfolios
Mitigation Strategies:
Federal Reserve Backstop:
- Pledge: Buy mortgage-backed securities if regional drops exceed 15%
- Creates floor (prevents panic spirals)
- Similar to 2008 interventions but proactive
Refinance Protection:
- Underwater homeowners (owe more than value) can refinance at current rates
- No penalty, no need for appraisal
- Prevents strategic defaults
Market Maker Entity:
- Treasury-backed corporation absorbs institutional inventory gradually
- Prevents forced dump sales
- Resells to qualified buyers (first-time, owner-occupiers) over time
- Smooths transition
Estimated Cost of Stabilization:
- Fed backstop: Minimal (pledge, rarely used)
- Refinance program: $10-20B (administrative)
- Market maker: $50-80B (capital fund, mostly recovered via resales)
- Total: $60-100B (worth it to prevent panic)
Rental Market Disruption:
The Math:
- 500k institutional rentals convert to owner-occupied
- Optimistic: 50% of displaced renters become owners (250k)
- Remaining: 250k renters need new housing
- Small landlord program preserves/grows supply (+1M over 5 years)
- Multi-family zoning creates new rentals (+500k over 5 years)
- Net: Adequate rental supply maintained
But Short-Term Pain (Years 1-2):
- Institutional rentals exiting faster than new supply coming online
- Temporary shortage: Rents spike 8-12% in Year 1
- Caps help (CPI + 1.5% on divesting properties) but black markets emerge
Solutions:
Emergency Rental Voucher Expansion:
- $30 billion over 3 years (2026-2028)
- Bridge displaced renters through transition
- Covers gap between capped rent and market
Accelerated Multi-Family Construction:
- Fast-track permitting (60-day max)
- Direct subsidies for rental apartments
- Target: 500k units in 3 years (emergency pace)
Tenant-in-Place Protections:
- Right to remain at capped rent until purchase or alternative found
- Relocation assistance ($3k-5k) if must move
- No displacement without housing
Revised Rental Transition Cost: $50 billion (not $30B originally estimated)
Constitutional Litigation Risk:
The Vulnerabilities:
Forced Divestiture:
- 5th Amendment: "nor shall private property be taken for public use, without just compensation"
- Question: Is forced sale (even at market value) a "taking"?
- Current Supreme Court: 6-3 conservative, skeptical of property regulations
100% Excise Tax:
- Functionally confiscatory
- Could be struck as punitive vs. regulatory
- Analogous to civil asset forfeiture (controversial)
Foreign Buyer Ban Precedent:
- Canada/New Zealand restrictions target non-citizens
- Sovereigns have broad power over foreigners
- Very different from restricting domestic property rights
Legal Strategy (Revised for Durability):
Option A: Progressive Taxation (Preferred)
Instead of forced divestiture + 100% tax:
- Phased property tax surcharge on SFH above caps:
- Homes 101-200 (institutional): +5% annual surcharge
- Homes 201-500: +10% annual
- Homes 501+: +15% annual
- Homes 11-20 (individual): +3% annual
- Homes 21+: +5% annual
- Economically incentivizes divestiture
- Legally safer (tax policy = Constitutional)
- Generates revenue ($5-10B/year)
Option B: Prospective Ban + Grandfather
- Existing owners can keep holdings
- But no new purchases above caps after Jan 1, 2026
- No entity transfers (can't sell to LLC you control)
- Natural attrition over 10-15 years as portfolios turn
Option C: Conditional Federal Funding (Most Constitutional)
- States that restrict institutional SFH ownership get infrastructure bonuses
- Those that don't, lose discretionary funding
- Precedent: Drinking age tied to highway funds (South Dakota v. Dole, 1987)
- Supreme Court upheld (Spending Clause authority)
Recommended Approach: Combine B + C
- Federal incentive for state action (Option C)
- States implement prospective ban + grandfather (Option B)
- Achieves goal over 10-15 years with minimal legal risk
- Slower but actually implementable
Litigation Budget: $5 billion over 10 years (legal defense, settlements if needed)
Total Costs (Revised, Comprehensive):
| Component | 10-Year Cost | Notes |
|---|---|---|
| Anti-Speculation | ||
| Enforcement/monitoring | $5B | FinCEN, tracking, audits |
| Litigation defense | $5B | Constitutional challenges |
| Supply-Side | ||
| Zoning reform | $20B | Federal enforcement, planning grants |
| Walkable districts | $50B | Bike lanes, sidewalks, transit |
| Adaptive reuse | $30B | Conversion grants (50% match) |
| Public housing | $150B | 1.5M units over 10 years |
| Workforce tax credits | $20B | Tax expenditure |
| Rental Preservation | ||
| Small landlord incentives | $25B | Property tax credits |
| Emergency rental support | $50B | Vouchers, transition aid |
| Alternative Housing | ||
| Co-ops | $30B | Formation grants, favorable loans |
| Co-housing | $20B | Common house construction |
| Community land trusts | $27B | Land acquisition |
| Tiny homes | $15B | Villages, infill, transition |
| Mobile communities | $16B | RV upgrades, ROC conversions |
| Market Stabilization | ||
| Fed backstop | $10B | MBS purchases if needed |
| Market maker entity | $60B | Inventory absorption (mostly recovered) |
| Refinance program | $20B | Underwater homeowner assistance |
| TOTAL HDSA COST | $553B over 10 years | $55.3B/year average |
Compare to Jubilee:
- Jubilee: $27 trillion one-time
- HDSA: $553 billion over 10 years
- HDSA is 2% of Jubilee cost
Return on Investment:
Without HDSA:
- Housing inflation: 15-20% annually × 5 years = 100% cumulative
- Total home values: $45T × 2 = $90T (2030)
- Appreciation captured: $45T
- Jubilee recipients' share: ~10% = $4.5T
- Existing owners/speculators capture: $40.5T
With HDSA:
- Housing inflation: 3-5% annually × 5 years = 25% cumulative
- Total home values: $45T × 1.25 = $56.25T (2030)
- Appreciation: $11.25T
- Jubilee recipients' share: ~40% = $4.5T (same absolute, much higher share)
- Existing owners: ~$6.75T
- Prevented recapture: $40.5T - $6.75T = $33.75T
ROI: $553B investment prevents $33.75T wealth extraction = 61x return
PART VII: INTEGRATION WITH JUBILEE - THE COMPLETE SYSTEM
How They Work Together:
Phase 1: Jubilee Debt Destruction (2026-2028)
- 270M adults receive $100,000
- $18.6T household debt paid off (mandatory)
- $8.4T deposited in Treasury savings (locked, collateral for self-loans)
- $1.15T annually in freed debt payments
Phase 2: HDSA Supply Surge Begins (2026-2030)
- Institutional divestiture: 100k homes/year
- Zoning reform: 400-600k units/year enabled
- Construction surge: Public + private adding 1.2-1.86M units/year
- Total new supply: 1.7-2.56M units/year (above baseline)
Phase 3: Jubilee Recipients Enter Housing Market (2027-2030)
Using Postal Bank Self-Loans for Down Payments:
Example: Maria (age 58, former student debt $25k)
- Jubilee allocation: $100,000
- Debt payoff: $25,000
- Treasury savings: $75,000
Wants to buy home: $350,000
- Down payment needed (10%): $35,000
- Self-loan against savings: $35,000 at CPI+2%
- If CPI = 4%, loan rate = 6%
- 10-year term = ~$390/month
- Mortgage: $315,000 at 7% = ~$2,095/month
- Total payment: $2,485/month
Previous rent: $1,800/month Previous student loan: $350/month Total previous: $2,150/month
Post-Jubilee cost: $2,485/month (only +$335 vs. renting + debt)
But now:
- Building equity (homeownership)
- Fixed payment (vs. rising rents)
- Self-loan repayment goes back to own savings (rebuilding nest egg)
The Integration:
| Jubilee Benefit | HDSA Support | Combined Result |
|---|---|---|
| Debt freedom | No rent gouging (caps) | Freed cash available |
| Treasury savings | Self-loan for down payment | Homebuying power |
| $1.15T freed annually | Ample housing supply | Stable prices |
| Bottom 50% wealth boost | Ownership expansion | Wealth-building |
Without HDSA:
- Maria's freed $350/month goes to higher rent (landlords capture)
- Home prices spike to $525k (unaffordable despite $75k savings)
- Jubilee benefit recaptured through housing inflation
With HDSA:
- Rent capped, home prices stable at $350k
- Maria's $75k savings = down payment via self-loan
- Jubilee benefit translates to homeownership
Wealth Distribution Outcomes (2040 Projection):
Current (2025):
- Bottom 50%: 2.5% of wealth ($1.1T)
- Top 1%: 30% of wealth ($13.2T)
- Home equity: $32T total, concentrated in top 50%
With Jubilee Only (No HDSA):
- Bottom 50%: 6-8% of wealth (Jubilee boost)
- But housing inflation recaptures 60-70%
- Net: Modest improvement, unsustainable
With Jubilee + HDSA:
| Wealth Component | Bottom 50% Share | Top 1% Share |
|---|---|---|
| Treasury savings (Jubilee) | $2.5-3T (22% of $12T total) | $300-500B (small share) |
| Home equity | $8-10T (25% of $40T total) | $8-10T (20%, down from 30%) |
| Other assets | $1.5-2T (mixed) | $15-20T (still concentrated) |
| TOTAL WEALTH | $12-15T (8-10% share) | $23-30T (20-25% share) |
Bottom 50% wealth share: 2.5% → 8-10% = 220-300% increase
Gini coefficient: 0.85 → 0.65-0.70 (major equality gain)
PART VIII: IMPLEMENTATION ROADMAP (2025-2040)
Legislative Phase (2025-2026):
2025 Q1-Q2:
- Draft comprehensive HDSA legislation (800+ pages)
- Coalition building:
- Progressive caucus (Democrats)
- YIMBY movement (housing advocates)
- Environmental groups (density = sustainability)
- Anti-poverty organizations
- Small landlord associations (Main Street program supporters)
- Economic modeling (CBO scoring, academic validation)
- Public education (town halls, media campaign)
2025 Q3-Q4:
- Introduction in Congress (House and Senate simultaneously)
- Committee hearings:
- Financial Services (anti-speculation provisions)
- Housing and Urban Development (zoning, construction)
- Ways and Means (tax credits, incentives)
- Judiciary (constitutional review)
- Markup and amendments
- Integrate with Jubilee package (comprehensive economic reform bill)
2026 Q1:
- Floor votes (House → Senate)
- Conference committee (reconcile versions)
- Presidential signature
- Effective Date: January 1, 2026 (institutional cap enforcement begins)
Infrastructure Phase (2026-2027):
Regulatory Setup:
- FinCEN beneficial ownership database expansion (track SFH portfolios)
- HUD zoning reform compliance monitoring (state/local oversight)
- IRS tax credit administration (DLTC program, workforce credits)
- Federal housing database (track sales, inventory, compliance)
Technical Assistance:
- Model zoning ordinances (for cities implementing reforms)
- Co-op/CLT formation guides (legal documents, governance)
- Tiny home building codes (IRC Appendix Q adaptation)
- ROC conversion playbooks (resident ownership transitions)
Grant Program Launches:
- Adaptive reuse applications (Q1 2027)
- Public housing RFPs (Q2 2027)
- Co-op formation grants (Q3 2027)
- Tiny home village grants (Q4 2027)
Market Stabilization:
- Fed MBS backstop pledge (announced, prevents panic)
- Market maker entity capitalization ($60B fund)
- Refinance program setup (servicer coordination)
Execution Phase (2027-2030):
Year-by-Year Milestones:
2027:
- Institutional divestiture: 50k homes (10% of 500k)
- First Jubilee tranches (ages 65+, 55-64) deployed
- Zoning reform deadline: States begin compliance
- First co-ops/CLTs close on properties
- Rental voucher expansion live
2028:
- Institutional divestiture: 50k more (20% of remaining 450k = 90k; cumulative 140k)
- Middle Jubilee tranches (ages 45-54, 35-44)
- Missing middle construction ramps up (+300k units)
- Individual ownership cap drops to 15 homes
- Public housing first projects break ground
2029:
- Institutional divestiture: 93k more (30% of remaining 310k; cumulative 233k)
- Final Jubilee tranches (ages 25-34, 18-24)
- Walkable districts show results (+500k units cumulative)
- ROC conversions hit 50k spaces
- Adaptive reuse projects delivering units
2030:
- Institutional divestiture: 107k more (40% of remaining 217k; cumulative 340k)
- Individual cap drops to 12 homes
- New construction peak: 2.5-3M units/year (including all sources)
- Housing inflation stabilized: 2-4% annually
Maturity Phase (2031-2040):
2031:
- Final institutional divestiture: 160k remaining (100% of 160k; COMPLETE)
- Individual cap reaches permanent 10 homes
- Market equilibrium: Supply matching/exceeding demand
- Institutional speculation eliminated
2032-2036:
- System optimization: Adjust incentives based on data
- 2036 Mandatory Review: Comprehensive assessment:
- Housing affordability achieved?
- Homeownership rate target met?
- Rental supply adequate?
- Inflation controlled?
- Adjust caps, incentives, programs as needed
2037-2040:
- Steady state: HDSA fully integrated into housing market
- Speculation minimal (<10% investor purchases maintained)
- Diverse housing stock (SFH, co-ops, tiny, multi-family options)
- Affordability maintained via permanent mechanisms (CLTs, public housing)
PART IX: ADDRESSING CRITIQUES (COMPREHENSIVE REBUTTALS)
Critique 1: "This Will Crash the Housing Market"
Rebuttal:
Crashes require forced liquidation + demand collapse. We have neither.
What HDSA creates:
- Phased divestiture (5 years, not immediate dump)
- Simultaneous demand surge (Jubilee buyers entering)
- Supply increase (construction, not just sales)
- Fed backstop (prevents panic spirals)
Historical comparison:
| Event | Forced Sales? | Demand Collapse? | Credit Freeze? | Result |
|---|---|---|---|---|
| 2008 Crash | YES (foreclosures) | YES (job losses) | YES (bank failures) | -40% prices |
| COVID Dip | NO (moratoriums) | NO (stimulus) | NO (Fed support) | -5%, rebounded |
| HDSA | Phased (5yr) | NO (Jubilee demand) | NO (Postal Bank) | Managed transition |
Projected:
- Temporary volatility: 10-20% swings in investor metros
- Net long-term: +15-25% appreciation over 5 years (healthy)
- NOT a crash, a rebalancing
Who benefits:
- First-time buyers (access expands)
- Renters converting to owners (wealth-building)
- Small landlords (incentivized, stable)
Who's disrupted:
- Mega-landlords (intended target)
- Speculators (intended target)
- Recent buyers (temporary paper losses, offset by Fed programs)
Risk mitigation:
- Market maker absorbs inventory
- Refinance programs protect underwater owners
- Fed MBS purchases if regional drops exceed 15%
Honest assessment: 10-20% volatility is real, but manageable and worth it to prevent $33.75T wealth extraction.
Critique 2: "This Is an Unconstitutional Taking"
Honest Acknowledgment:
Original HDSA (forced divestiture + 100% tax) has high litigation risk.
Revised Approach (Constitutionally Durable):
Option A: Progressive Property Tax (Preferred)
- Not a "taking": Tax policy (established Constitutional authority)
- Economically equivalent (costly to hold excess homes)
- Legally safer (Supreme Court upholds tax policies)
- Precedent: Progressive income tax, estate tax, etc.
Option B: Prospective Ban + Grandfather
- Existing holdings allowed (no forced sale = no taking)
- Prospective only: Can't buy more (regulatory authority)
- Natural attrition (as portfolios turn over)
- Precedent: Zoning changes apply going forward, grandfather existing uses
Option C: Federal Funding Leverage
- States choose: Implement restrictions OR lose discretionary funding
- Precedent: South Dakota v. Dole (1987) - drinking age tied to highway funds
- Supreme Court: 10% funding withholding = constitutional
- HDSA: 15% withholding = within precedent
Recommended Implementation:
- Federal law uses Option C (funding leverage)
- States implement Option A or B (progressive tax or prospective ban)
- Achieves goal over 10-15 years with minimal legal risk
Budget for litigation: $5B over 10 years (settlements if any challenges succeed)
Honest trade-off: Slower timeline (15 years vs. 5) but actually implementable without Supreme Court striking down.
Critique 3: "Rents Will Skyrocket from Reduced Supply"
Honest Acknowledgment:
Short-term (Years 1-2): Rent pressure is real.
The math:
- 500k institutional rentals exit
- Optimistic: 50% of tenants become owners (250k conversions)
- Remaining: 250k renters need new housing
- Temporary shortage = 8-12% rent spikes in Year 1
But mitigation prevents crisis:
Supply-Side:
- Small landlord program: Preserves 12-13M rentals + adds 1M over 5 years
- Multi-family zoning: Enables 500k new rental apartments (3 years)
- Public housing: 150k rental units/year
- Net: Rental supply grows, not shrinks
Demand-Side:
- Emergency rental vouchers: $30B over 3 years (bridge displaced renters)
- Tenant-in-place rights: Can't be displaced without alternative housing
- Rent caps: CPI + 1.5% on divesting properties
Timeline:
- 2027: Rental crunch (8-12% spikes despite caps)
- 2028: New supply coming online (pressure eases to 4-6%)
- 2029-2030: Surplus developing (rents stabilize at CPI+0-2%)
Long-term: More rental units than baseline + better quality (DLTC standards)
Revised rental support cost: $50B (higher than originally stated, but worth it)
Critique 4: "This Punishes Small Landlords"
Rebuttal:
HDSA explicitly REWARDS small landlords (1-10 homes):
Main Street Housing Provider Program:
- Property tax credits (5-10% annually)
- Postal Bank favorable loans (CPI+1% for improvements)
- Quality bonuses (excellence tier)
- Community partnership recognition
Who's targeted:
- Mega-landlords: 100+ homes (Wall Street)
- Large speculators: 20+ homes (hoarding)
Who's protected:
- Small landlords: 1-10 homes (80% of rental supply)
- Mid-size: 11-20 homes (grace period, then 5-year transition to 10)
Data:
- Median small landlord: 3-5 homes
- 90th percentile: 8-12 homes
- 10-home cap captures 90%+ of small landlords with no disruption
Phased cap timeline:
- 2026-2027: 20 homes (grace period)
- 2028-2029: 15 homes (gradual step)
- 2030: 12 homes (approaching final)
- 2031+: 10 homes (permanent)
5-year transition for those currently 11-20 homes:
- Time to adjust business model
- Sell 1-2 homes/year (manageable)
- Diversify into other investments
- OR maintain 10 highest-quality properties
Result: Small landlords thrive, mega-landlords exit, mid-size adjust.
Critique 5: "Alternative Housing (Tiny, Co-ops) Won't Scale"
Honest Assessment:
You're partially right: These are niche, not mainstream.
Projected Adoption:
| Housing Type | Units (10yr) | % of New Supply | % of Total Stock (2040) |
|---|---|---|---|
| Traditional SFH | 6-7M | 60-65% | Majority (75-80%) |
| Missing middle (duplex-8plex) | 2-3M | 20-25% | Growing (8-10%) |
| Apartments (multi-family) | 1-1.5M | 10-12% | Stable (15-18%) |
| Co-ops | 200k | 2% | Niche (0.5%) |
| Co-housing | 100k | 1% | Ultra-niche (0.2%) |
| CLTs | 150k | 1.5% | Niche (0.4%) |
| Tiny homes | 200k | 2% | Niche (0.5%) |
| Mobile (RV/manufactured) | 400k | 3-4% | Growing (3-4%) |
These alternatives are 10% of new supply, not 50%.
But that's the point:
Not everyone wants SFH. 10% do want alternatives.
Current problem: Zoning/financing make alternatives illegal or impossible
HDSA solution: Legalize and support, let market decide
Who benefits:
- Young singles: Tiny homes ($50k vs. $400k)
- Minimalists: Less stuff, lower footprint
- Community-seekers: Co-housing (intentional neighbors)
- Equity-builders: Co-ops (affordable ownership)
- Nomads: Mobile communities (flexibility)
- Transition populations: Homeless → tiny home village → permanent
These serve unmet niches, not replace mainstream.
Cost-benefit:
- Investment: $108B (co-ops + co-housing + CLTs + tiny + mobile)
- Serves: 1-1.5M people (niche but meaningful)
- Worth it for diversity + serving populations mainstream housing ignores
Critique 6: "This Is Too Expensive"
Honest Numbers:
Total HDSA Cost: $553B over 10 years
Breakdown:
- Anti-speculation: $10B
- Supply-side: $270B
- Rental preservation: $75B
- Alternative housing: $108B
- Market stabilization: $90B
Compare to:
| Program | Cost | Benefit |
|---|---|---|
| HDSA | $553B (10yr) | Prevents $33.75T recapture |
| Jubilee | $27T (one-time) | Eliminates $18.6T debt |
| Annual defense | $850B/year | National security |
| 2017 Tax cuts | $1.5T (10yr) | Mostly to top 1% |
| 2008 Bank bailouts | $700B (TARP) + trillions (Fed) | Saved financial system |
HDSA is 2% of Jubilee cost, prevents 68% of benefit recapture.
ROI: 61x return ($553B → saves $33.75T)
Is it worth it?
Without HDSA:
- Jubilee frees $27T
- Housing inflation recaptures $33.75T
- Net: Jubilee recipients LOSE wealth (housing costs rise faster than debt freedom)
- Policy failure, progressive economics discredited
With HDSA:
- Jubilee frees $27T
- Housing costs rise modestly ($11.25T appreciation, mostly to new owners)
- Net: Jubilee recipients BUILD wealth (homeownership, stable costs)
- Policy success, transformative
Yes, $553B is expensive. Letting Jubilee fail is infinitely more expensive.
PART X: PROJECTED IMPACTS - THE 15-YEAR SCENARIO (2025-2040)
Phase 1: Implementation (2026-2028)
Economic:
- Institutional panic: Prices dip 10-15% in investor metros (Atlanta, Phoenix)
- Jubilee deployment: First waves (ages 55+) receive $100k
- Demand surge begins: 200k new buyers/year
- Zoning reform compliance: States begin missing middle legalization
- Housing inflation: 5-8% (volatility, not stability yet)
Social:
- Institutional rentals: Begin exit (100k/year sales)
- Tenant displacement concerns: Emergency vouchers deployed
- First co-ops/CLTs: 10-20k units formed
- Small landlords: Enroll in DLTC program (tax credits begin)
Supply:
- Construction ramp-up: +200k units/year (above baseline)
- Adaptive reuse: First mall/office conversions
- Tiny home villages: 20-30 communities break ground
- Total new supply: 1.1-1.3M units/year
Phase 2: Expansion (2029-2032)
Economic:
- Prices rebound: Jubilee demand counters panic (whipsaw +12-18%)
- Supply catching up: 1.5-2M units/year (all sources)
- Individual cap: Drops to 12, then 10 homes (mid-size landlords adjust)
- Housing inflation: 4-7% (stabilizing but still elevated)
Social:
- Homeownership rate: 65% → 67% (+2 percentage points)
- Institutional exit: 80% complete (400k of 500k sold)
- Rental supply: Growing (small landlords + multi-family)
- Wealth gap: Bottom 50% now hold 6-7% of wealth (from 2.5%)
Supply:
- Missing middle boom: 500k units/year (duplexes, ADUs, small apartments)
- Public housing: 50k units/year completed
- Co-housing: 50 communities (5k units) operational
- Total new supply: 1.9-2.4M units/year
Phase 3: Maturity (2033-2036)
Economic:
- Market equilibrium: Supply exceeds demand in most markets
- Housing inflation: 3-5% (healthy, sustainable)
- Institutional presence: <1% of market (effectively eliminated)
- Small landlords: Thriving (10-home portfolios, quality-focused)
Social:
- Homeownership rate: 68-70% (highest since 2004)
- Bottom 50% wealth: 8-9% (tripled from baseline)
- 2036 Review: Comprehensive assessment, data-driven adjustments
- Alternative housing: 800k units (co-ops, tiny, CLTs, co-housing)
Supply:
- Steady state: 2.5-3M units/year (diverse types)
- Land trusts: 120k units (permanent affordability)
- Walkable districts: 40% of urban areas (from 15%)
Phase 4: Steady State (2037-2040)
Economic:
- Housing inflation: 2-4% (normalized, matched to income growth)
- Investment market: <10% of purchases (small landlords, owner-adjacent buyers)
- Affordability: Median price-to-income = 3.5-4x (healthy, from 5.3x)
- Rental market: 30% of households (choice, not constraint)
Social:
- Homeownership: 70-72% (broad-based, not top-heavy)
- Wealth distribution: Bottom 50% now 9-10% (4x increase from 2.5%)
- Housing diversity: Options at all price points ($50k tiny → $400k SFH → $200k co-op)
- Community resilience: Co-housing, CLTs provide social fabric
Supply:
- Total housing stock: 93-96M units (from 86M in 2025)
- +7-10M units added (8-12% increase)
- Diverse: 75% SFH, 10% missing middle, 10% multi-family, 5% alternative
Comparative Table (2025 vs 2040):
| Metric | 2025 Baseline | 2040 Projection | Change | Goal Met? |
|---|---|---|---|---|
| HDSA Metrics | ||||
| Total housing units | 86M | 93-96M | +8-12% | ✓ |
| Homeownership rate | 65.6% | 70-72% | +6.7-9.8% | ✓ |
| Institutional SFH ownership | 500k (0.6%) | <50k (<0.1%) | -90% | ✓ |
| Investor purchases (% of sales) | 25-30% | <10% | -67% | ✓ |
| Housing inventory (months) | 4.4 | 5.5-6.5 | +25-48% | ✓ |
| Median price-to-income ratio | 5.3x | 3.5-4.0x | -25-34% | ✓ |
| Rental supply (SFH) | 15M | 16-17M | +7-13% | ✓ |
| Alternative housing (co-ops, tiny, CLT) | ~500k | 1.3-1.5M | +160-200% | ✓ |
| Housing Inflation | ||||
| Annual (2025) | ~5% | 2-4% | Normalized | ✓ |
| 5-year cumulative (2026-2030) | 75-100% (w/o HDSA) | 15-25% (w/ HDSA) | -75% prevented | ✓ |
| Median home price | $400k | $460-500k | +15-25% | ✓ |
| Wealth Distribution | ||||
| Bottom 50% wealth share | 2.5% | 9-10% | +260-300% | ✓ |
| Bottom 50% home equity | ~$1T | $8-10T | +700-900% | ✓ |
| Top 1% wealth share | 30% | 20-25% | -17-33% | ✓ |
| Gini coefficient (wealth) | 0.85 | 0.65-0.70 | -18-24% | ✓ |
| Affordability | ||||
| Median rent | $1,964 | $2,350-2,550 | +20-30% | ⚠️ |
| Rent burden >30% income | 48% | 35-40% | -17-27% | ✓ |
| Households able to afford median home | 29% | 45-50% | +55-72% | ✓ |
| Cost & Investment | ||||
| HDSA 10-year cost | N/A | $553B | New expenditure | N/A |
| Prevented wealth recapture | N/A | $33.75T | ROI: 61x | ✓ |
Summary:
- ✓ All primary goals achieved
- ⚠️ Rent increases above inflation (but burden decreases due to income gains from Jubilee)
- Transformative wealth redistribution (bottom 50% quadruples share)
- Housing access expanded (homeownership +6.7-9.8 percentage points)
- Speculation curbed (institutional <0.1%, investor <10%)
- Supply diversified (SFH, co-ops, tiny, CLTs, multi-family options)
CONCLUSION: THE INDISPENSABLE COMPANION
Ladies and gentlemen, I have presented the most comprehensive, honest, and rigorously analyzed case for the Housing De-Financialization & Stability Act.
What HDSA Actually Is:
Not:
- ❌ Government takeover of housing
- ❌ Destruction of private property rights
- ❌ Elimination of rental market
- ❌ Forced communal living
But:
- ✓ Anti-speculation regulation (Wall Street out, Main Street protected)
- ✓ Supply surge mandate (zoning reform, construction, diverse options)
- ✓ Rental market stabilization (small landlords incentivized, quality improved)
- ✓ Housing diversity support (co-ops, tiny, mobile, CLTs for those who want them)
- ✓ Wealth recapture prevention (Jubilee benefits stay with recipients, not extracted)
Why It's Non-Negotiable:
The Math:
- Jubilee creates 400-600k new buyers/year (freed debt payments → down payments)
- Without HDSA: Supply adds 900k/year (baseline) = 300k-600k shortage
- Result: 15-20% annual housing inflation = $33.75T recapture by wealthy/speculators
- With HDSA: Supply adds 1.7-2.56M/year = 1.1-1.96M surplus
- Result: 3-5% annual inflation = Jubilee benefits preserved
Without HDSA, the Jubilee fails. With HDSA, it transforms America.
The Honest Trade-Offs:
Costs:
- ✗ $553B over 10 years (federal investment)
- ✗ 10-20% price volatility in investor metros (temporary)
- ✗ 8-12% rent spikes Year 1 (mitigated by vouchers)
- ✗ Institutional investor disruption (intended)
- ✗ Constitutional litigation risk (manageable with revised approach)
Benefits:
- ✓ $33.75T wealth recapture prevented (61x ROI)
- ✓ Housing inflation: 15-20% → 3-5% (controlled)
- ✓ Homeownership: 65% → 70-72% (+6.7-9.8 points)
- ✓ Bottom 50% wealth: 2.5% → 9-10% (quadrupled)
- ✓ +7-10M housing units (diverse types)
- ✓ Speculation eliminated (<10% investor share)
- ✓ Rental supply maintained/improved (16-17M units, higher quality)
The Corrections Made:
I did not present the original, flawed version. I corrected:
- Demand-supply math (acknowledged 400-600k excess demand without supply surge)
- Rental crisis (added $50B for preservation, small landlord incentives)
- Price volatility (honest 10-20% swings, not smooth 5-10%)
- Construction mandates (added $270B for zoning, building, public housing)
- Constitutional approach (progressive tax + federal leverage, not forced sales)
- Alternative housing scale (realistic 10% of supply, not oversold)
Total cost revised: $50B → $553B (11x increase, but honest)
But ROI remains extraordinary: 61x return
The Additions Integrated:
Your ideas made this complete:
- Small landlord incentives (DLTC program, $25B)
- Co-op/co-housing funding ($50B, 300k units)
- Multi-family zoning mandates (federal leverage, +2-3M units)
- Tiny home communities ($15B, 200k units)
- Mobile/RV support ($16B, 400k spaces)
These add housing diversity that serves unmet niches.
The Integration with Jubilee:
| Without HDSA | With HDSA |
|---|---|
| Jubilee: $27T deployed | Jubilee: $27T deployed |
| Housing inflation: 15-20%/year | Housing inflation: 3-5%/year |
| Wealth recapture: $33.75T | Wealth recapture: $6.75T |
| Bottom 50% net gain: Modest | Bottom 50% net gain: Transformative |
| Homeownership: 65% → 66% | Homeownership: 65% → 70-72% |
| Policy failure | Policy success |
The Precedents:
- Zoning reform: Minneapolis (2018), Oregon (2019) eliminated SFH-only, housing supply surged
- Institutional limits: Canada (foreign buyer ban, 2023), New Zealand (same)
- Co-ops: NYC (200k+ units, stable for decades)
- CLTs: 225+ in U.S. (perpetual affordability works)
- Tiny homes: Portland, Austin successful villages
- ROCs: 1,000+ nationwide (resident ownership viable)
- Federal leverage: Drinking age (1984), worked perfectly
HDSA combines proven elements into comprehensive system.
The Timeline:
- 2025-2026: Legislation, passage
- 2026-2030: Implementation (divestiture, construction surge, Jubilee integration)
- 2031-2036: Maturity (speculation eliminated, supply abundant, 2036 review)
- 2037-2040: Steady state (housing market transformed, sustainable)
The Stakes:
If we do nothing:
- Jubilee recipients freed from debt
- Only to see benefits recaptured through rent/price inflation
- Wealth still concentrates at top
- Housing crisis worsens
- Progressive economics discredited
- Opportunity wasted
If we pass HDSA:
- Jubilee benefits translate to homeownership
- Wealth redistributes meaningfully (bottom 50% quadruples share)
- Housing becomes affordable again (price-to-income 3.5-4x)
- Speculation eliminated (<10% investor market)
- Diverse housing options (SFH, co-ops, tiny, mobile, CLTs)
- Transformative success
The Choice:
Accept $553B cost to prevent $33.75T wealth extraction
OR
Save $553B and watch $27T Jubilee fail through housing inflation
I choose the former.
For an America where:
- Housing is shelter, not speculation
- Homeownership is accessible, not hoarded
- Communities are diverse, not segregated
- Wealth is shared, not extracted
- Jubilee transforms lives, not just balance sheets
For 270 million Americans who deserve:
- Debt freedom (Jubilee)
- Housing stability (HDSA)
- Economic security (UBI)
- Dignity and opportunity
I urge adoption of HDSA as the indispensable companion to Jubilee.
Because transformation requires both:
- Jubilee: Frees capital
- HDSA: Protects capital
- Together: Builds shared prosperity
Thank you.
APPENDIX: COMPREHENSIVE SOURCES & DATA
Housing Market Data (2025):
- U.S. Census Bureau: Housing units, homeownership rate, inventory
- National Association of Realtors (NAR): Median prices, sales volume, investor share
- Redfin: Q3 2024 investor purchases (17%)
- CNBC: Q2 2025 peak investor activity (30-33% specific metros)
- Trading Economics: October 2025 inventory (4.4 months)
- Zillow: Median rent ($1,964/month, Oct 2024)
- CoStar: Office vacancy rates (18-20% national)
- Coresight Research: Mall closures (25% by 2025)
Institutional Landlord Data:
- Invitation Homes: SEC filings, ~85,000 SFH portfolio
- American Homes 4 Rent: SEC filings, ~61,000 SFH portfolio
- Other REITs/PE firms: ~350,000 combined (estimate from industry reports)
Jubilee Integration Data:
- Federal Reserve: Household debt Q3 2025 ($18.6 trillion)
- Average household debt service: ~$800-1,200/month (various sources)
- Freed debt payments: $1.15-1.44 trillion annually (calculated)
Construction & Supply:
- Census: New housing starts (1.4M annual, 900k SFH)
- Zoning reform potential: Minneapolis (2018 case study), Oregon (2019)
- Missing middle estimates: Urban Institute, Terner Center studies
Alternative Housing:
- Housing co-op data: National Association of Housing Cooperatives
- CLT data: Grounded Solutions Network (225+ CLTs nationwide)
- Tiny home movement: Tiny House Industry Association
- RV/mobile: RVIA (RV Industry Association), ~1-2M full-time residents
- Co-housing: Cohousing Association of the US (~170 communities)
Economic Analysis:
- MMT framework: L. Randall Wray, Stephanie Kelton
- Housing economics: Edward Glaeser, Joseph Gyourko (Wharton)
- Wealth inequality: Federal Reserve Survey of Consumer Finances
- ROI calculations: Original analysis based on appreciation prevented
Legal Precedents:
- South Dakota v. Dole (1987): Federal funding leverage
- Penn Central v. New York (1978): Taking vs. regulation test
- Lucas v. South Carolina (1992): Regulation eliminating value
- Wickard v. Filburn (1942): Commerce Clause authority
- Berman v. Parker (1954): Police power for public welfare
Program Models:
- Singapore public housing: Housing & Development Board (HDB)
- Vienna social housing: Wiener Wohnen
- Alaska Permanent Fund: Dividend program (universal since 1982)
- ROC USA: Resident-owned community conversions
- Dignity Village (Portland), Community First! (Austin): Tiny home villages for homeless
Inflation & Market Analysis:
- COVID housing inflation: Case-Shiller Index, FHFA data
- 2008 crash comparison: CoreLogic, Federal Reserve data
- Price-to-income ratios: Joint Center for Housing Studies (Harvard)
- Rent burden data: Harvard Joint Center, HUD
All calculations, projections, and syntheses are original analysis integrating these sources.